Tougher times ahead for Ford Ranger and Toyota Hilux
Increased competition and fresh tech is set to make life tougher for the heavy hitters of the ute marketLife could be about to get a lot tougher for the Ford Ranger and Toyota Hilux.
Ute sales in Australia have retreated from their 2023 highs and shed market share in an increasingly competitive market that’s set to welcome ambitious new competitors over the next 18 months.
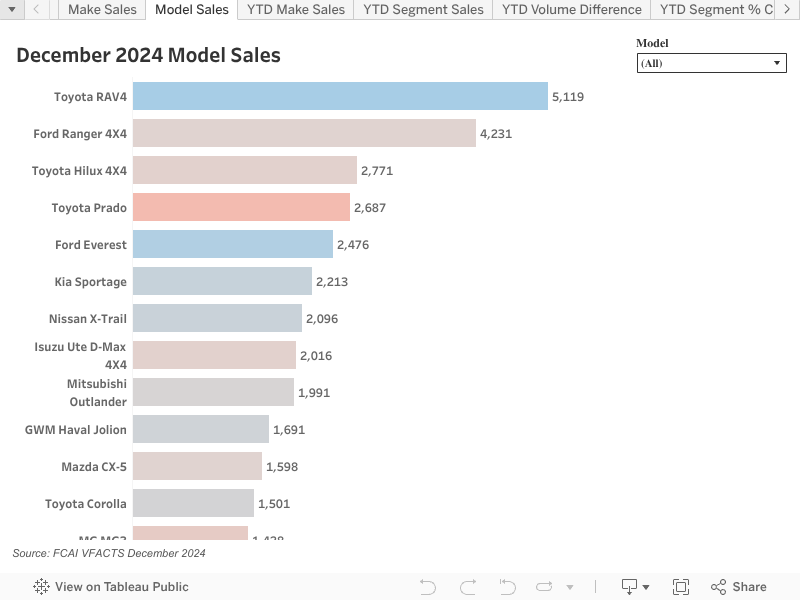
The changing dynamic for vehicles that make up almost one in five new vehicle sales mean sales of the two big boys in the ute market – the Ford Ranger and Toyota Hilux, which between them account for almost half of all ute sales – could continue to slide, according to Toyota Australia vice president of sales, marketing and franchise operations, Sean Hanley.
In confirming the Hilux was no longer the top selling Toyota in the country – it’s handed the mantle to the RAV4 – Hanley said the ute market could fragment further with the imminent arrival of new models such as the Kia Tasman and BYD Shark 6, the latter the first of many plug-in hybrid utes expected soon.
“We already know that the number of ute models available to Australian buyers will expand rapidly,” he said.
“They’ll all be competing for an overall ute market that is likely to remain steady, which suggests that the average sales per model will come down.”
Hanley suggested annual sales of between 45,000 and 55,000 would be good for the leaders in the ute market, which is well down on the 60,000-plus sales in recent years for the Hilux and Ranger.
“The ute market, it’s changing now,” added Hanley. “I expect that ute sales by marque could drop.”
Ford Australia president and CEO Andrew Birkic didn’t say whether the brand expected its sales to drop as a result of increased competition, but did say: “We welcome the competition, and believe that we offer Aussie customers a great line-up of vehicles that meet their needs now and into the future”.
Aussies bought 239,830 new utes in 2024, a drop of 4.0 per cent.


That figure includes large American pick-up trucks that now account for about 10,000 sales annually, or about 4.4 per cent of the ute segment.
And the market share of utes dropped to 19.4 per cent, the lowest level since 2019 (where 19.0 per cent of new vehicles sold were utes) and well down from the market high of 21.2 per cent in 2021.
Asked whether Australia had hit ‘peak ute’, Hanley replied: “I think so. ’22 to ’24 were big years for utes.
“We’re going to get an incredible amount of new entrants into that market … on top of an already crowded market.”
The Hilux isn’t quite the heavy hitter it was for Toyota a few years ago. In 2022 it accounted for 27.9 per cent of Toyota Australia sales whereas in 2024 that dropped to 22.2 per cent.


To some extent the Hilux is caught up in the general drop in sales of two-wheel drive (4x2) utes.
Until 2006 Australians bought more 4x2 utes than 4x4 ones, partly off the back of locally made Ford Falcon and Holden Commodore utes.
These days the 4x4 ones dominate, accounting for a record 89.1 per cent of ute sales.
One thing in the Hilux’s favour is the imminent arrival of an all-new model, the first since 2015.
“It’s coming towards the end of its life cycle,” Hanley said of the current Hilux, while refusing to elaborate on exactly when a new model is due, other than to reiterate it was in the works.
“Hilux is important to us so we’re not going to take the foot off the accelerator, and we have no intention of dropping it.”
That new generation Hilux will be offered as an electrified model by 2030.
Hanley has previously said a full battery electric version of the Hilux could make it into showrooms in the next few years.
Toyota is also understood to be working on a hybrid version of the Hilux.
Ute sales in Australia
Year | Ute Sales | Market % | Overall Sales |
2024 | 239,830 | 19.4% | 1,237,287 |
2023 | 249,762 | 20.5% | 1,216,780 |
2022 | 228,671 | 21.1% | 1,081,429 |
2021 | 222,345 | 21.2% | 1,049,831 |
2020 | 179,392 | 19.6% | 916,968 |
2019 | 201,652 | 19.0% | 1,062,867 |
2018 | 211,285 | 18.3% | 1,153,111 |
2017 | 207,615 | 17.5% | 1,189,116 |
2016 | 190,768 | 16.2% | 1,178,133 |
2015 | 174,660 | 15.1% | 1,155,408 |
2014 | 175,373 | 15.8% | 1,113,224 |
2013 | 182,915 | 16.1% | 1,136,227 |
2012 | 173,769 | 15.6% | 1,112,032 |
2011 | 152,029 | 15.1% | 1,008,437 |
2010 | 153,008 | 14.8% | 1,035,574 |
2009 | 153,206 | 16.3% | 937,328 |
2008 | 156,120 | 15.4% | 1,012,164 |
2007 | 153,297 | 14.6% | 1,049,982 |
2006 | 137,184 | 14.3% | 962,666 |
2005 | 142,262 | 14.4% | 988,269 |
2004 | 137,990 | 14.4% | 955,229 |
2003 | 121,636 | 13.4% | 909,811 |
2002 | 104,035 | 12.6% | 824,309 |
2001 | 89,188 | 11.5% | 772,861 |
2000 | 86,809 | 11.0% | 787,100 |
1999 | 91,168 | 11.6% | 786,845 |
1998 | 83,893 | 10.4% | 807,000 |
1997 | 72,999 | 10.1% | 722,427 |
1996 | 70,394 | 10.8% | 650,049 |
Source: VFACTS, Federal Chamber of Automotive Industries
Related: Battery-electric Toyota Hilux could be on-sale within five years
Related: 2026 Toyota Hilux could have a carry-over engine
Related: 2025 Kia Tasman makes global debut
Related: BYD Shark 6 2025 Review
Join the conversation at our Facebook page
Or email us at editor@carsales.com.au
Or email us at editor@carsales.com.au
Tags


Please see our Editorial Guidelines & Code of Ethics (including for more information about sponsored content and paid events). The information published on this website is of a general nature only and doesn’t consider your particular circumstances or needs.